
SAFe Flow Metrics: Velocity, Time, Efficiency, and Load Explained
Updated on Aug 04, 2026 | 228 views
Share:
Table of Contents
View all
Quick Overview
- SAFe Flow Metrics measure how efficiently value moves through a value stream, helping teams improve delivery speed, predictability, and business outcomes.
- The four-core metrics are Flow Velocity (work completed), Flow Time (time to deliver), Flow Efficiency (active work vs waiting time), and Flow Load (work in progress).
- Together, these metrics help teams identify bottlenecks, optimize flow, and deliver value faster.
- In this guide, you'll learn what each SAFe flow metric measures how to track and improve them, and how they work together to enhance Agile performance.
Build enterprise Agile leadership skills with the AI-Empowered Leading SAFe® 6.0 Training course.
Master the Right Skills & Boost Your Career
Avail your free 1:1 mentorship session
What Are SAFe Flow Metrics?
SAFe Flow Metrics are a set of measurements that evaluate how work progresses through a value stream, from the moment it is requested until it is delivered to customers.
Unlike traditional Agile metrics that often focus on team output, SAFe Flow Metrics emphasize the movement of value across the entire system. This broader perspective helps organizations identify delays, improve predictability, and deliver customer value more consistently.
Why Flow Metrics Matter in SAFe
Enterprise Agile involves multiple teams working on interconnected features, dependencies, and business priorities. Without clear visibility, work can slow down even when every team appears busy.
SAFe Flow Metrics provide this visibility by helping leaders understand where work is waiting, where teams are overloaded, and how quickly value reaches customers. Rather than relying on assumptions, decisions are based on measurable data.
For example, if a feature spends three weeks waiting for approvals before development begins, the issue is not development speed but process delays. Flow metrics highlight this hidden inefficiency so it can be addressed.
The Four Core SAFe Flow Metrics at a Glance
SAFe recommends four primary metrics that work together to provide a complete view of delivery performance.
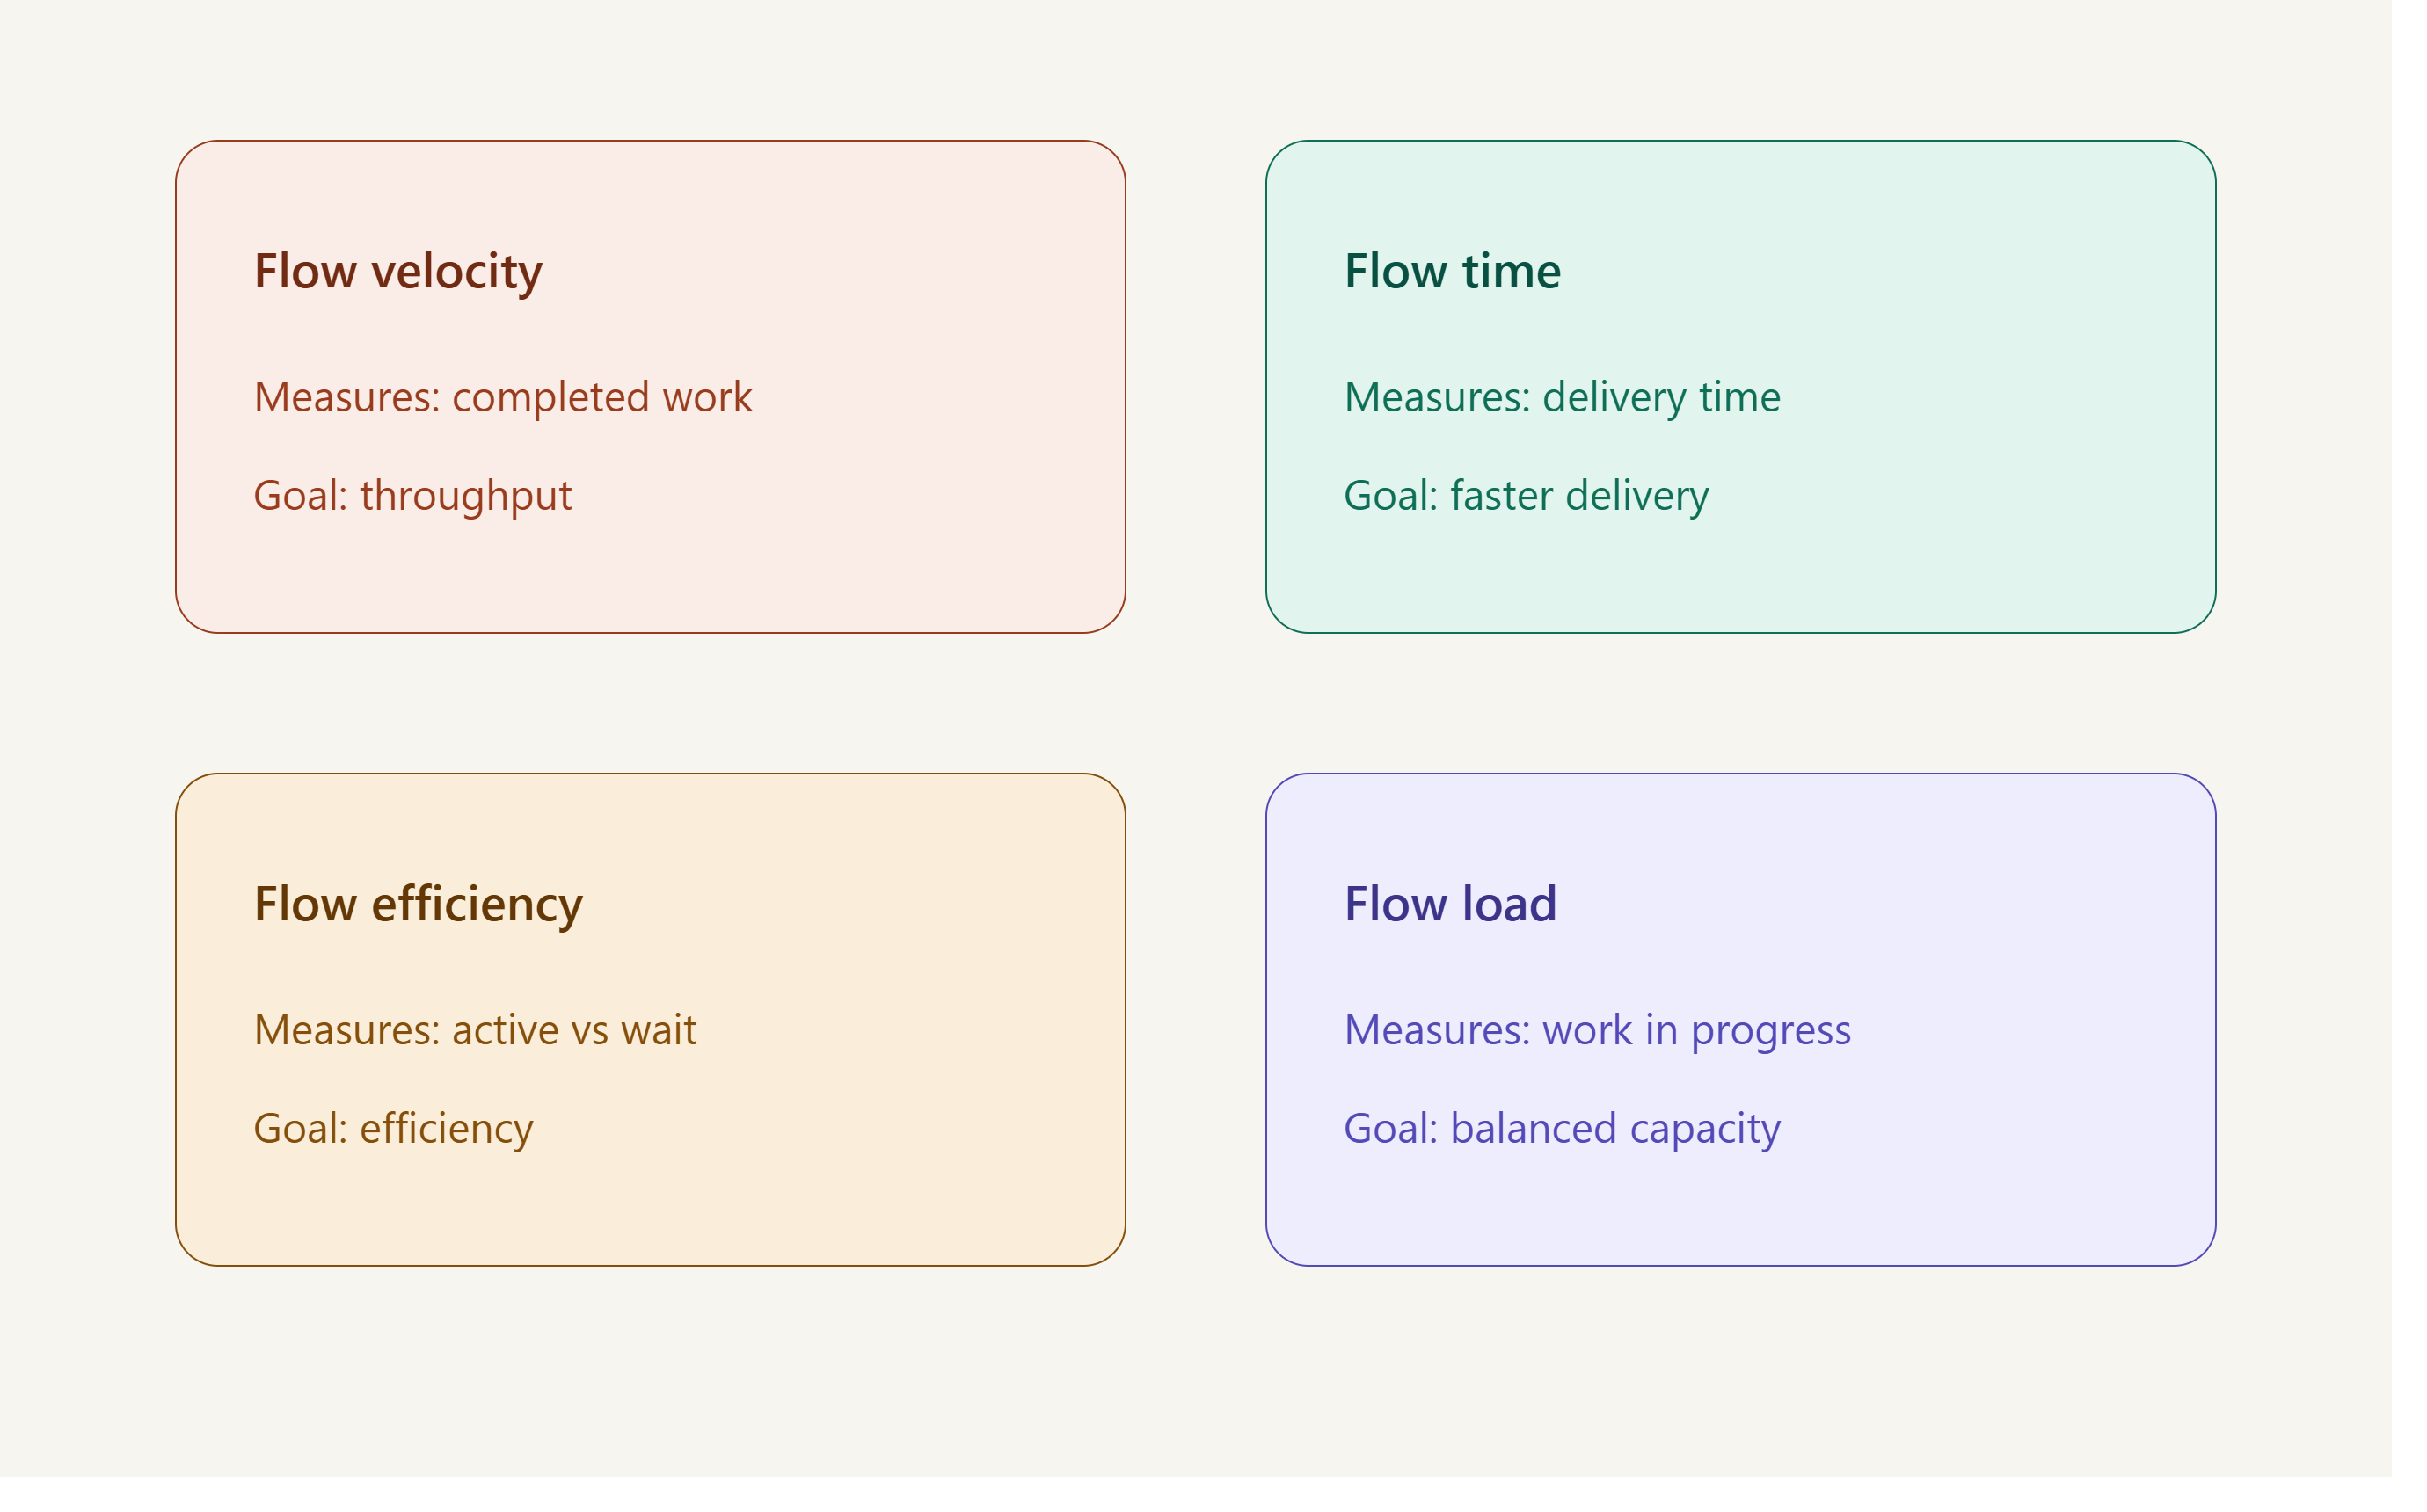
Each metric answers a different question. Together, they create a balanced picture of delivery performance rather than relying on a single measurement.
How Flow Metrics Support Business Agility
Business agility depends on delivering the right value at the right time. SAFe Flow Metrics help organizations make better decisions by providing real-time insights into delivery performance.
For example, during PI execution, leadership may discover that one ART consistently experiences long review cycles. Instead of assigning more developers, they can streamline approvals and reduce delays, resulting in faster customer value.
By continuously reviewing these metrics, organizations improve planning, reduce uncertainty, and respond to changing business priorities with greater confidence.
Understand the principles that guide SAFe adoption in SAFe and Its Core Values.
Metric 1: Flow Velocity
Flow Velocity measures how many work items are completed during a specific period. Unlike traditional team velocity, which focuses on story points, Flow Velocity measures completed value items such as Features, Capabilities, or Epics.
This metric helps organizations understand delivery throughput across the value stream rather than the productivity of individual teams.
What Is Flow Velocity?
Flow Velocity represents the number of completed work items delivered within a defined timeframe, such as an iteration or Program Increment.
For example, if an Agile Release Train completes 18 Features during one PI and 22 during the next, its Flow Velocity has increased. This suggests that the system is delivering value more effectively, provided quality remains consistent.
Unlike story points, completed work items are easier for business stakeholders to understand because they directly relate to customer value.
Why Flow Velocity Matters
A consistent Flow Velocity indicates a stable delivery system. Large fluctuations often reveal changing priorities, resource constraints, or hidden bottlenecks.
For instance, an organization launching a digital banking application may consistently complete twenty customers facing Features for each Program Increment. If Flow Velocity suddenly drops to ten, leadership can investigate dependency issues, approval delays, or resource shortages before customer commitments are affected.
Stable Flow Velocity also improves forecasting, making PI Planning more reliable.
How to Measure Flow Velocity
Flow Velocity is calculated by counting completed Flow Items during a specific reporting period.
Formula
Flow Velocity = Number of Completed Flow Items
For example:
- PI 1: 18 completed Features
- PI 2: 21 completed Features
- PI 3: 20 completed Features
This steady trend indicates predictable delivery performance.
Many organizations track this metric using tools such as Jira Align, Azure DevOps, or other Agile portfolio management platforms.
Also Read: What Is SAFe Advanced Scrum Master?
Metric 2: Flow Time
Flow Time measures how long it takes for a work item to move through the value stream from the moment work begins until it is delivered. It answers one of the most important business questions: "How quickly can we deliver value?"
Unlike Flow Velocity, which measures output, Flow Time focuses on speed. Together, these SAFe Flow Metrics help organizations understand not only how much work they complete but also how long customers wait to receive it.
What Is Flow Time?
Flow Time is the total elapsed time required to complete a Flow Item. It includes both active work and any waiting time throughout the delivery process.
For example, suppose a Feature enters development on Monday and is released three weeks later. Its Flow Time is three weeks, even if developers actively worked on it for only eight days. The remaining time may have been spent waiting for approval, testing, or deployment.
This makes Flow Time one of the most practical SAFe Flow Metrics because it reflects the customer's perspective. Customers care about when they receive value, not how busy development teams are.
Factors That Increase Flow Time
Several factors can increase Flow Time even when development teams perform well.
Common causes include:
- Long approval cycles.
- Frequent priority changes.
- Large Features that take longer to complete.
- Cross team dependencies.
- Delays in testing or deployment.
- Limited access to subject matter experts.
Real Life Example
A healthcare company found that development took only six days, but compliance reviews delayed every Feature by two weeks. By involving compliance specialists earlier in PI Planning, the organization reduced Flow Time by almost 35 percent.
This example shows why SAFe Flow Metrics help uncover problems that are often invisible in traditional project reporting.
Ways to Reduce Flow Time
Reducing Flow Time is less about working faster and more about removing unnecessary delays.
Teams can improve Flow Time by:
- Breaking Features into smaller increments.
- Automating testing and deployment.
- Resolving dependencies earlier.
- Improving collaboration between teams.
- Prioritizing work more effectively during PI Planning.
Organizations that regularly review SAFe Flow Metrics often discover that improving collaboration produces greater results than simply adding more developers.
Explore Best Agile Management Certification Training Courses to find the right certification path for your Agile career.
Metric 3: Flow Efficiency
Flow Efficiency measures how much of the total Flow Time is spent actively working compared to waiting. It helps teams understand whether work is moving continuously or sitting idle during the delivery process.
Even if Flow Velocity appears healthy, poor Flow Efficiency may indicate that work spends too much time waiting between activities. This makes Flow Efficiency one of the most valuable SAFe Flow Metrics for identifying hidden waste.
What Is Flow Efficiency?
Flow Efficiency represents the percentage of total Flow Time during which a work item is actively being developed, tested, reviewed, or deployed.
Imagine a Feature that takes ten days to complete.
- Developers actively work for four days.
- The Feature waits six days for reviews, approvals, or testing.
Although the Feature is completed within ten days, only four days involved productive work.
This indicates relatively low Flow Efficiency.
How Flow Efficiency Is Calculated
Flow Efficiency is calculated using a simple formula.
Flow Efficiency = (Active Work Time ÷ Total Flow Time) × 100
Example
- Active development: 5 days
- Total Flow Time: 10 days
Flow Efficiency = (5 ÷ 10) × 100 = 50%
This means half of the delivery time involved productive work, while the remaining half was spent waiting.
Teams do not always need perfect Flow Efficiency. Instead, they should aim for continuous improvement by reducing unnecessary delays.
Common Causes of Low Flow Efficiency
Low Flow Efficiency usually points to process issues rather than team performance.
Some common causes include:
- Waiting for stakeholder approvals.
- Excessive work in progress.
- Limited testing resources.
- Frequent context switching.
- Manual deployment processes.
- Dependency delays across Agile teams.
Live Example
A retail company discovered that completed Features waited an average of five days before entering user acceptance testing because only one testing environment was available. After adding a second testing environment, Flow Efficiency improved significantly without increasing development effort.
This is why organizations rely on SAFe Flow Metrics to improve the entire delivery system rather than evaluating individual productivity.
Tips to Improve Flow Efficiency
Improving Flow Efficiency requires reducing waiting time throughout the value stream.
Some practical approaches include:
- Limit work in progress.
- Automate repetitive testing activities.
- Improve communication between dependent teams.
- Reduce approval layers.
- Encourage continuous integration and continuous delivery practices.
Small process improvements made consistently often have a greater impact than large organizational changes. As organizations mature, reviewing SAFe Flow Metrics during every Program Increment helps sustain these improvements and maintain a steady flow of customer value.
Discover the career advantages and value of earning a SAFe® certification in Why You Should Consider a SAFe® Agile Certification.
Metric 4: Flow Load
Flow Load measures the amount of work currently in progress within a value stream or Agile Release Train (ART). It helps teams understand whether they have taken on more work than they can realistically complete. Among the four SAFe Flow Metrics, Flow Load is closely linked to delivery stability because too much work in progress often leads to delays, context switching, and reduced productivity.
What Is Flow Load?
Flow Load is the total number of Flow Items that are actively being worked on at a given point in time. These items may include Features, Capabilities, Enablers, or Defects depending on how the organization tracks work.
For example, if an ART has 40 active Features but can realistically complete only 20 during a Program Increment, the Flow Load is likely too high. This imbalance often causes teams to switch between tasks, delaying delivery across multiple initiatives.
Unlike Flow Velocity, which measures completed work, Flow Load focuses on work that is still in progress.
Why Flow Load Is Important
A balanced Flow Load helps teams stay focused and deliver work consistently. When too many items are started at once, priorities become unclear, dependencies increase, and delivery slows down.
Live Example
A software company assigned five major Features to every development team at the same time. Developers frequently switched between priorities, leaving many Features partially completed. After limiting the number of active Features to two per team, delivery became more predictable, and customer releases became more frequent.
This example demonstrates how SAFe Flow Metrics encourage organizations to finish work before starting new initiatives.
Managing Work in Progress with Flow Load
Managing Flow Load is largely about controlling Work in Progress (WIP). Teams should avoid accepting new work until existing priorities are completed.
Some practical ways to manage Flow Load include:
- Set Work in Progress limits.
- Prioritize the highest business value first.
- Complete existing Features before starting new ones.
- Review workload during ART Sync meetings.
- Rebalance work across teams when necessary.
Organizations that actively manage Flow Load often experience smoother Program Increment execution and fewer last minute delivery issues.
Signs Your Flow Load Is Too High
Excessive Flow Load usually becomes visible through recurring delivery problems.
Common warning signs include:
- Multiple unfinished Features.
- Frequent task switching.
- Missed PI Objectives.
- Longer Flow Time.
- Growing dependency risks.
- Reduced team focus.
When these symptoms appear together, it is often an indication that teams have accepted more work than they can effectively manage. Regular reviews of SAFe Flow Metrics help identify these trends before they affect customer commitments.
Learn the path, skills, and requirements for Becoming a SAFe® 5 Program Consultant.
Comparing the Four SAFe Flow Metrics
The four SAFe Flow Metrics provide different insights into how work moves from idea to delivery. Flow Velocity shows how much value is delivered, Flow Time measures how quickly work reaches completion, Flow Efficiency highlights the time spent on active work versus waiting, and Flow Load shows whether teams have too much work in progress.
Analyzing these metrics together gives organizations a complete view of delivery performance and helps them identify areas where improvements are needed.
When to Use Each Metric
Different situations call for different metrics.
Use Flow Velocity when forecasting future delivery capacity or measuring throughput.
Use Flow Time when customers experience delays or releases are consistently late.
Use Flow Efficiency when work appears to spend too much time waiting between activities.
Use Flow Load when teams seem overwhelmed or multiple initiatives remain unfinished.
The greatest value comes from combining these SAFe Flow Metrics rather than relying on a single measurement. For example, increasing Flow Velocity while Flow Efficiency continues to decline may indicate that teams are simply taking on more work instead of improving the delivery process.
Explore the foundation of scaled Agile practices with What Are the SAFe Agile Principles.
How to Measure SAFe Flow Metrics
Measuring SAFe Flow Metrics requires tracking how work moves through the value stream from start to delivery. Organizations should collect reliable data from Agile tools, establish performance baselines, and regularly review trends during Program Increment execution.
Instead of focusing on individual numbers, teams should use these measurements to identify delays, improve workflows, and make continuous improvements across the Agile Release Train.
Data Sources and Tools
Most organizations measure SAFe Flow Metrics using Agile management platforms that capture work item movement automatically.
Common tools include:
- Jira Align
- Jira Software
- Azure DevOps
- Digital.ai Agility
- Planview AgilePlace
- ServiceNow Agile Development
These tools generate dashboards that help leadership monitor throughput, waiting time, work in progress, and overall delivery trends.
Setting Baselines and Targets
Before setting improvement goals, organizations should understand their current performance.
For example:
- Average Flow Time: 18 days
- Average Flow Velocity: 24 Features per PI
- Flow Efficiency: 42%
- Flow Load: 38 active Features
Once a baseline is established, realistic improvement targets can be introduced gradually instead of expecting dramatic changes within a single Program Increment.
Reviewing Metrics During PI Execution
Flow metrics should be reviewed regularly rather than only during Inspect and Adapt workshops.
Many organizations discuss these metrics during:
- ART Sync meetings
- Scrum of Scrums
- System Demos
- PI Progress Reviews
- Inspect and Adapt events
Regular reviews allow teams to identify emerging bottlenecks early and take corrective action before delivery commitments are affected.
Learn the key steps to successfully adopt SAFe with the SAFe Implementation Roadmap.
Best Practices for Improving SAFe Flow Metrics
Improving SAFe Flow Metrics is not about increasing pressure on teams. It is about improving the entire delivery system so that value reaches customers faster and more predictably.
Key Takeaways
- Focus on improving the system, not individual productivity.
- Make continuous improvement of everyday work.
- Use metrics to guide conversations rather than judge teams.
Reduce Work in Progress
Too much work in progress creates delays, increases context switching, and reduces overall focus.
Limit the number of active Features, complete existing work before starting new initiatives, and encourage teams to finish rather than constantly begin additional work.
Eliminate Bottlenecks
Bottlenecks often occur in approvals, testing, security reviews, or deployment activities.
Live Example
An online retail company discovered that every release waited three days for manual testing. By introducing automated regression testing, releases moved through the pipeline much faster, reducing Flow Time and improving Flow Efficiency without increasing team size.
Build Continuous Improvement into PI Planning
PI Planning should include discussions about improving delivery flow, not just committing to Features.
Teams can:
- Review previous Program Increment metrics.
- Identify recurring bottlenecks.
- Set measurable improvement goals.
- Assign improvement actions alongside business Features.
Organizations that consistently evaluate SAFe Flow Metrics during every Program Increment create a culture of continuous learning instead of reactive problem solving. This approach strengthens predictability, improves collaboration, and helps Agile Release Trains deliver customer value more consistently.
Conclusion
SAFe Flow Metrics help organizations understand how efficiently work moves through the delivery process, making them valuable for enterprises managing multiple Agile teams and Agile Release Trains. By tracking Flow Velocity, Flow Time, Flow Efficiency, and Flow Load, teams can identify bottlenecks, improve predictability, and deliver value faster.
If your organization is practicing SAFe, start by establishing baseline metrics and reviewing them during every Program Increment. Remember, SAFe Flow Metrics are not designed to measure team performance but to drive continuous improvement across the entire value stream.
Contact our upGrad KnowledgeHut experts for personalized guidance on choosing the right course, career path, and certification to achieve your goals.
Frequently Asked Questions (FAQs)
Can SAFe Flow Metrics be used by teams outside software development?
Yes. Although they are widely used in software delivery, SAFe Flow Metrics can also benefit marketing, product development, operations, and other business functions that manage work through a value stream. Any team focused on improving delivery flow can apply these metrics.
How often should organizations review SAFe Flow Metrics?
Most organizations review them throughout the Program Increment rather than waiting until the end. Regular discussions during ART Sync meetings, System Demos, and Inspect and Adapt workshops help teams identify issues early and make timely improvements.
Do SAFe Flow Metrics replace Scrum metrics like Sprint Velocity?
No. They complement rather than replace traditional Scrum metrics. Sprint Velocity helps Scrum teams estimate future work, while SAFe Flow Metrics provide an enterprise-wide view of how efficiently value moves across multiple teams and value streams.
Can improving one Flow Metric negatively affect another?
Yes. Focusing only on increasing Flow Velocity, for example, may lead to excessive Work in Progress, which can increase Flow Load and reduce Flow Efficiency. The four metrics should always be evaluated together to maintain a balanced delivery system.
Who is responsible for monitoring SAFe Flow Metrics?
Monitoring is a shared responsibility. Release Train Engineers, Product Managers, Scrum Masters, Agile Teams, and business leaders all contribute to reviewing and acting on the insights generated by these metrics to improve overall delivery performance.
Are SAFe Flow Metrics useful for remote and distributed Agile teams?
Absolutely. Since distributed teams often face communication delays and cross team dependencies, SAFe Flow Metrics provide valuable visibility into delivery performance. They help leaders identify bottlenecks regardless of where teams are located.
Should organizations set target values for each SAFe Flow Metric?
Yes, but targets should be based on historical performance and continuous improvement rather than industry benchmarks. Realistic goals encourage sustainable progress without creating unnecessary pressure on teams.
Can automation improve SAFe Flow Metrics?
Yes. Automating testing, deployments, approvals, and reporting can significantly reduce waiting time and manual effort. This often leads to shorter Flow Time, higher Flow Efficiency, and more consistent delivery across Program Increments.
What is the biggest mistake organizations make when using SAFe Flow Metrics?
A common mistake is using the metrics to evaluate individual or team performance. SAFe Flow Metrics are designed to improve the delivery system, not to compare teams or measure employee productivity.
How long does it take to see improvements after implementing SAFe Flow Metrics?
The timeline varies depending on the organization, but many teams begin identifying meaningful trends after one or two Program Increments. Consistent measurement and continuous improvement typically produce noticeable results over several planning cycles.
1639 articles published
KnowledgeHut is an outcome-focused global ed-tech company. We help organizations and professionals unlock excellence through skills development. We offer training solutions under the people and proces...
Get Free Consultation
By submitting, I accept the T&C and
Privacy Policy
Ready to learn about Agile Certifications Roadmap?